On worldwide and historical CO2 emissions
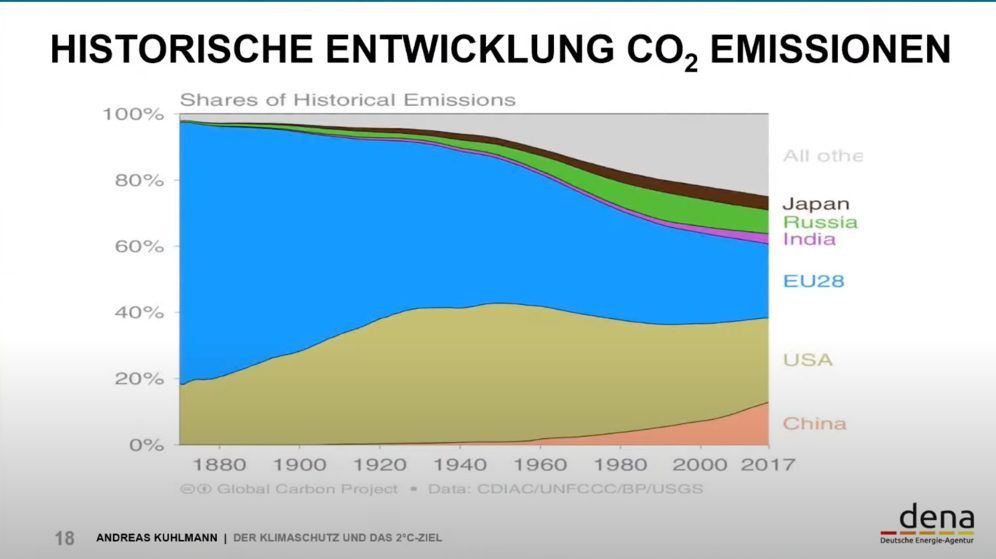
These are essential charts. The first chart shows the worldwide CO2 emission per capita and per country. The second chart shows the shares of historical emissions.

Audio voiceover
0:00
/0:48
These are essential charts. The first chart shows the worldwide CO2 emission per capita and per country. The second chart shows the shares of historical emissions. All these things have to be put side by side—the international scientific community is doing this. Here the questions arise as to who is actually responsible for what. How is this going to continue? Who actually has to help whom? How do we come to binding agreements? How are we going to solve this, and by which technology? This is not an easy matter, and our world leaders are playing tit for tat games.